
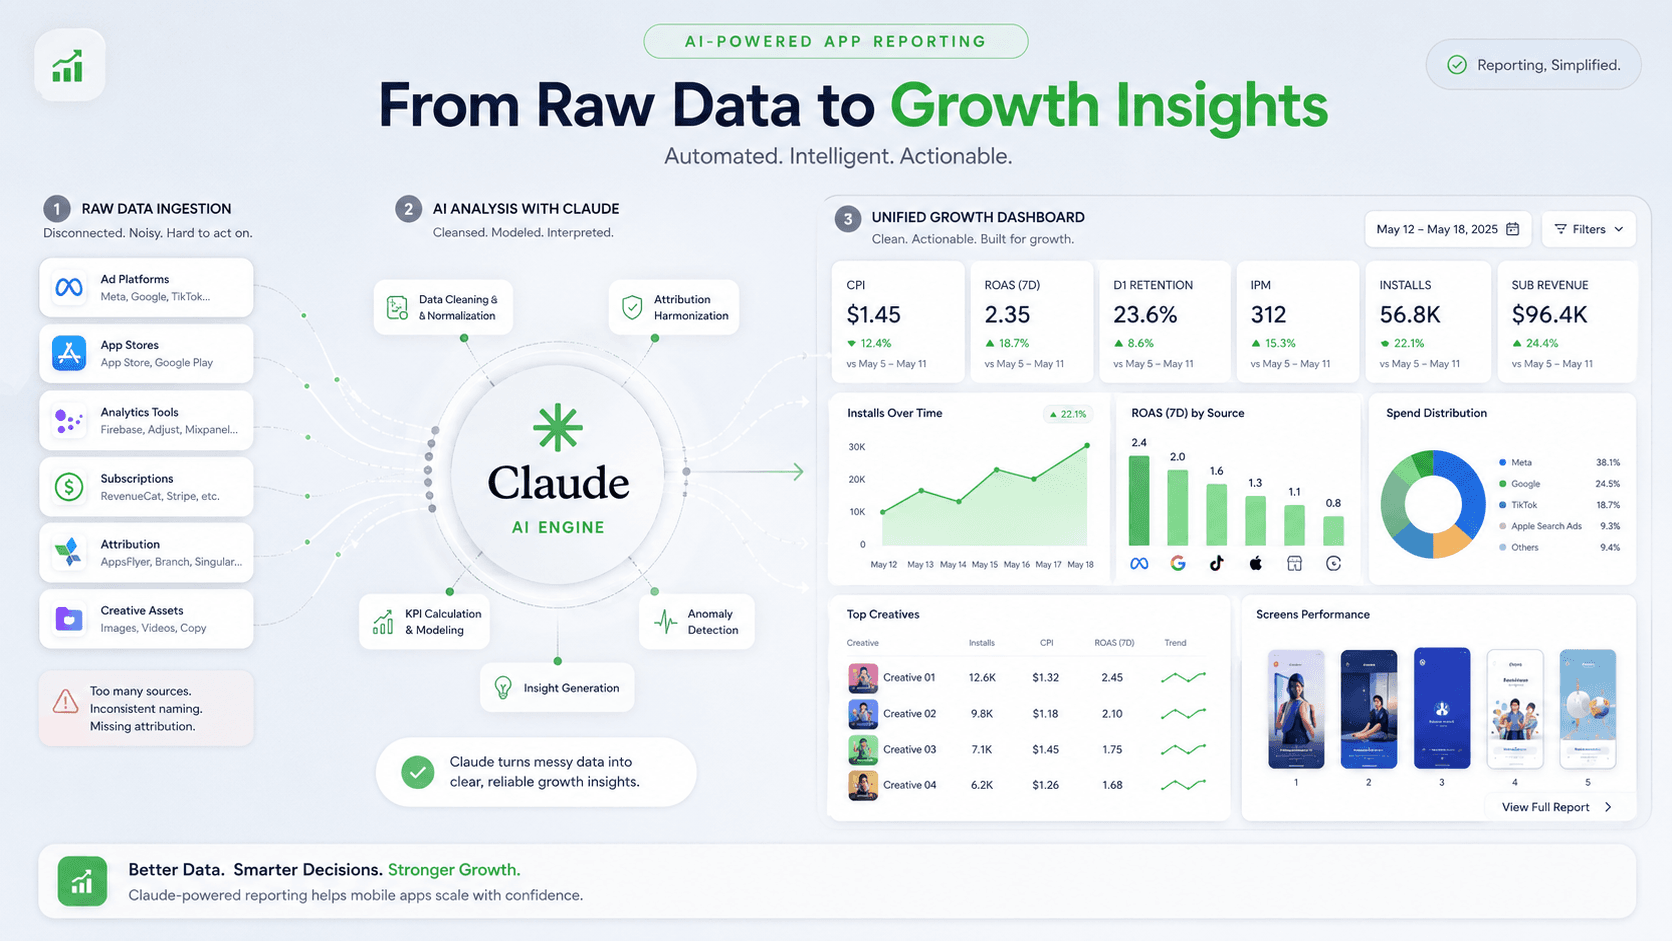
UA reporting is critical and soul-destroying at the same time. Like filing your taxes, but every Monday.
Here is the short answer. You can automate most of your weekly UA reporting with AI by setting up one Claude Project per game or app, loading it once with fixed instructions and three skill files (benchmarks, analysis logic, output format), then pasting your MMP or ad network export each week and running a one-line prompt. Setup takes about 30 minutes per title. After that, a full network, campaign, and creative level report takes roughly 2 minutes instead of a few hours of exporting, cleaning, and formatting.
This guide gives you the exact setup, copy-paste ready. No code required.
TL;DR
→ One Claude Project per title. Never mix two games in one project. → Paste the Project Instructions once and fill in every variable. → Upload 3 skill files: SKILL.md (logic), kpi-benchmarks.md (your targets), output-templates.md (format). → Every Monday, paste your data and type "Run Report 1" (or 2, or 3). → You get a colour-coded report at network, campaign, or creative level, scored against your own KPIs.
What you actually get
Three structured reports from one setup, each colour coded against your benchmarks:
→ Report 1, network level: last 4 rolling weeks per network and platform, with totals and week over week deltas. → Report 2, campaign level: current week, one row per campaign, sorted by spend. → Report 3, creative level: current week, one row per creative, with fatigue and top performer flags.
Green means at or above target. Orange means within 20% below. Red means more than 20% below. The point is not prettier tables. The point is that Claude tells you which numbers are worth your attention before you go looking.
Why this works (and why it is not just a chatbot)
A Claude Project is a persistent workspace. It holds fixed instructions and reference files, so Claude does not need re-briefing every week. Add the right instructions and three skill files once, paste your data on Monday, and get a full report in one shot.
The result behaves like an analyst who already knows your KPIs and has read your previous reports. It never asks why the numbers look odd this week. It just tells you.
The setup checklist
- Create a new Claude Project.
- Paste the Project Instructions and fill in all variables.
- Upload the 3 skill files to the project knowledge base.
- Run your first report with the Monday starter prompt.
Full detail for each step below.
Step 1) Create the Claude Project
Go to claude.ai → Projects → New Project.
Name it using this format so projects stay sortable and unambiguous:
[Company] – [Title] – [Year]
Example: Velocity Games – Solitaire – 2026
One project per title. Always. Never mix two clients or two games in the same project. Context bleeds between accounts and output quality drops fast.
Step 2) Paste the Project Instructions
Open Project Instructions and paste the template below. Fill in every [VARIABLE] before running anything. Leave unknowns as TBD.
## Company Name: [Company NAME]
Type: [Studio / App developer / Publisher]
HQ: [Country] | Size: [Indie / Mid-size / Publisher]
## Title Name: [TITLE NAME]
Genre: [e.g. Match 3 / Solitaire / Casual / Utility]
Platform: [iOS / Android / Both]
Status: [Soft launch / Scaling / Live / Pre-launch]
Key markets: [e.g. US, DE, UK, AU]
## UA Setup Monthly budget: [e.g. ~$50K]
Active channels: [Meta / UAC / TikTok / ASA]
Attribution: [AppsFlyer / Adjust / TBD]
Scope: [Full-service / Reporting only / Strategy]
## Goal [One sentence, e.g. "Scale Android installs profitably while maintaining D7 ROAS above 40%."]
## KPIs Primary: [e.g. D7 ROAS / CPI]
Secondary: [e.g. D30 Retention / CTR / ARPU]
Benchmarks: [e.g. Target CPI < $1.20 on Android US, or TBD]
## Output style [Client-facing / Internal / Investor-ready] | Currency: [EUR / USD]
## Standing rules - Reports: Summary, Findings, Channel Breakdown, Recommendations, Next Steps
- Use tables for performance data. Flag week over week anomalies proactively.
- Recommendations must be channel-specific and actionable.
- If data is missing, ask one clarifying question before proceeding.
Update the instructions when scope changes. If budget, channels, or KPIs shift, update the Project Instructions, not just the chat. The instructions are Claude's ground truth for this client.
Step 3) Upload the 3 skill files
These three files go into every project knowledge base. They tell Claude how to process your data, what the benchmarks are, and what the output should look like. Do not edit them unless you are updating your reporting logic or benchmarks.
File 1: SKILL.md (the logic)
This is the brain. It tells Claude how to ingest, normalise, score, and structure the report.
---
name: weekly-ua-report
description: >
Generate weekly UA performance reports for mobile game and app clients.
Use this skill whenever a team member pastes channel or MMP data and wants a report,
summary, analysis, or breakdown. Triggers on: "run the weekly report", "analyse this
week's data", "prepare the client report", "what does this data show", or any paste of
tabular UA data from Meta, Google UAC, TikTok, ASA, AppsFlyer, or Singular.
Always load this skill before attempting any analysis or report generation.
--- # Weekly UA Report Produces three reports and one slide narrative from MMP data pasted by the team.
Read references/output-templates.md for exact column structures, formatting rules, and slide copy format.
Read references/kpi-benchmarks.md for this title's targets before scoring any metric.
## Data maturity rule, read this first D7 Retention and D7 ROAS require a full 7-day cohort. The current week is never mature.
- Current week: leave Retention D7 and ROAS D7 blank. Do not populate, do not score.
- Prior weeks (W-1, W-2, W-3): populate and score normally.
- Never flag a blank D7 cell in the current week as missing data. It is intentionally excluded.
- Never reference D7 ROAS or D7 Retention for the current week in the slide narrative.
## Step 1, identify sources | Source | Maps to |
|---|---|
| Meta Ads Manager | Network: Meta |
| Google UAC | Network: GoogleUAC |
| TikTok Ads | Network: TikTok |
| Apple Search Ads | Network: ASA |
| AppsFlyer / Singular | MMP, use for Installs, eCPI, Retention, ROAS |
Always prefer MMP data over network-reported data for Installs, eCPI, Retention, and ROAS.
## Step 2, normalise into standard schema | Field | Format | Notes |
|---|---|---|
| Week | W[XX] YYYY | e.g. W12 2026 |
| Network | Meta / GoogleUAC / TikTok / ASA | |
| Platform | iOS / Android | Never combine, always separate rows |
| Cost | €0 | 0 decimal places |
| Installs | Integer | MMP installs preferred |
| eCPI | €0.00 | 2 decimal places |
| CTR | 0.00% | 2 decimal places |
| CVR | 0.00% | 2 decimal places |
| Retention D1 | 0.0% | 1 decimal place |
| Retention D7 | 0.0% | 1 decimal place, blank for current week |
| ROAS D1 | 0.0% | 1 decimal place |
| ROAS D7 | 0.0% | 1 decimal place, blank for current week |
## Step 3, score against benchmarks - GREEN = at or above target
- ORANGE = within 20% below target
- RED = more than 20% below target
- Blank = no formatting (current week D7 columns, or genuinely unavailable data)
## Step 4, flag anomalies | Condition | Flag label |
|---|---|
| Spend change more than ±30% WoW | Budget shift |
| eCPI increase more than +25% WoW | eCPI spike |
| ROAS D1 drop more than -20% WoW | ROAS drop |
| CTR drop more than -30% WoW | Creative fatigue |
| CTR or ROAS D1 more than +20% above campaign average | Append TOP to creative name |
| MMP vs network installs gap more than 20% | Attribution gap |
## Step 5, build the three reports Report 1, network level: last 4 rolling weeks per network. One row per network/platform/week. TOTALS and DELTA rows at bottom.
Report 2, campaign level: current week only. One row per campaign/platform. Sorted by Cost descending.
Report 3, creative level: current week only. One row per creative/campaign/platform. Sorted by Cost descending within each campaign.
## Step 6, write the slide narrative Five slides. Client-facing. Follow word counts in output-templates.md.
- Lead with what matters most.
- Every data point must have an implication.
- Recommendations must name the network and the specific action.
- Max 3 recommendations.
- No filler phrases.
## Step 7, missing data - Ask one clarifying question to recover the most critical missing piece.
- Do not block report generation. Produce what is available and mark missing fields as blank.
- Never substitute zeroes for blank.
File 2: kpi-benchmarks.md (your targets)
This is the one file you have to make your own. Fill in your CPI, ROAS, CTR, and retention targets by channel and platform. Client-provided targets always win over anything here.
---
title: [TITLE NAME]
platform: Android + iOS
last_updated: [DATE]
owner: [YOUR NAME]
--- # KPI Benchmarks, [TITLE NAME] Scoring: GREEN = at/above target | ORANGE = within 20% below | RED = more than 20% below
## ROAS | Metric | Android | iOS |
|---|---|---|
| D1 ROAS | >% | >% |
| D7 ROAS | >% | >% |
| D30 ROAS | >% | >% |
## CPI | Channel | Android | iOS |
|---|---|---|
| Meta | >€ | >€ |
| Google UAC | >€ | >€ |
| TikTok | >€ | >€ |
| ASA | N/A | >€ |
## Engagement | Metric | Android | iOS |
|---|---|---|
| CTR, Meta | >% | >% |
| CTR, TikTok | >% | >% |
| IPM, Meta | > | > |
| IPM, TikTok | > | > |
## Retention | Metric | Android | iOS |
|---|---|---|
| D1 Retention | >% | >% |
| D7 Retention | >% | >% |
| D30 Retention | >% | >% |
## MMP vs channel discrepancy | Threshold | Action |
|---|---|
| Less than 10% gap | Normal, no action |
| 10 to 20% gap | Monitor, check attribution window |
| More than 20% gap | Flag to client |
## Notes - Fill in targets once you have 2 to 3 weeks of live data.
- iOS and Android benchmarks often differ due to ATT, track separately.
- Client-provided targets always override the values in this file.
File 3: output-templates.md (the format)
This locks the column order and the 5-slide structure so every report looks the same, every week.
# Output Templates, Weekly UA Report Always split iOS and Android into separate rows. Never combine platforms.
## Report 1, Network Level Column order: Week | Network | Platform | Cost | Installs | eCPI | Retention D1 | Retention D7 | ROAS D1 | ROAS D7
- 4 weeks of data per network/platform combination
- TOTALS row: sum Cost and Installs, blended eCPI = total Cost / total Installs
- DELTA row: WoW % change. Format: +12% or -8%
- Current week: Retention D7 and ROAS D7 must be blank
## Report 2, Campaign Level Column order: Week | Campaign Name | Platform | Cost | Installs | eCPI | Retention D1 | Retention D7 | ROAS D1 | ROAS D7
- Current week only. Sort by Cost descending.
- TOTALS row per platform
- Current week: Retention D7 and ROAS D7 must be blank
## Report 3, Creative Level Column order: Week | Campaign Name | Creative Name | Platform | Cost | Installs | eCPI | CTR | CVR | Retention D1 | Retention D7 | ROAS D1 | ROAS D7
- Current week only. Sort by Cost descending within campaign.
- Group by Campaign Name with a blank row between groups
- CTR drop >30% WoW, append FATIGUE to creative name
- ROAS D1 or CTR >20% above campaign avg, append TOP to creative name
- Current week: Retention D7 and ROAS D7 must be blank
## Slide Narrative, 5 Slides Slide 1, Weekly summary (max 60 words)
Headline: [Most important thing this week]
Body: Week [X] | Spend: [€X] ([±X%] WoW) | Installs: [X] ([±X%] WoW) | eCPI: [€X]
2 to 3 sentences. Lead with biggest win or concern.
Slide 2, Network performance (max 80 words)
Headline: [Which network is leading or lagging]
Body: [Network]: [stat], [implication] × 3
Slide 3, Creative performance (max 80 words)
Headline: [Top creative insight]
Top: [Name] | CTR: [X%] | CVR: [X%] | eCPI: [€X] | ROAS D7: [X%]
Fatiguing: [Name] | CTR down [X%] WoW, recommend pausing
Slide 4, Anomalies (max 80 words)
Headline: [Most important flag or "No major anomalies"]
[Flag]: [What], [Why it matters], [Response]
Slide 5, Next steps (max 100 words)
Headline: Actions for W[next]
1. [Network], [action], [expected outcome] × 3
Tone rules: no filler phrases, every data point has an implication, max 3 recommendations, never reference current week D7.
Step 4) The weekly starter prompt
Run this once a week. Paste it into a new conversation inside the client's project, then paste your export underneath.
Weekly UA report, W[XX] [YEAR] Choose your report:
## Report 1, Network Level Prompt: "Run Report 1"
[paste MMP export here]
Example structure:
| Week | Network | Platform | Cost | Installs | eCPI | Ret D1 | Ret D7 | ROAS D1 | ROAS D7 |
## Report 2, Campaign Level Prompt: "Run Report 2"
[paste MMP export here]
Example structure:
| Week | Network | Platform | Campaign | Cost | Installs | eCPI | Ret D1 | Ret D7 | ROAS D1 | ROAS D7 |
## Report 3, Creative Level Prompt: "Run Report 3"
[paste MMP export here]
Example structure:
| Week | Network | Platform | Campaign | Creative Name | Cost | Installs | eCPI | CTR | IR | IPM | Ret D1 | Ret D7 | ROAS D1 | ROAS D7 |
--- PRIOR WEEK DATA (for WoW delta) ---
[paste, or leave blank if unavailable]
Start a new chat for big reports. For a deep dive or a monthly review, open a fresh conversation inside the project. Do not continue an old thread. Context clutter degrades output quality.
Tips for the best output
→ Paste data directly. Copy tables straight from Sheets or export a CSV. Claude handles raw data without pre-formatting. → One project per title. Do not mix titles in one project. Context bleeds between accounts. → Update instructions as scope changes. New budget, channel, or KPI goes in Project Instructions, not just the chat. → Start fresh for big analyses. A new conversation inside the project keeps the context clean.
What this automates, and what it does not
Worth being clear-eyed, since AI automation gets oversold a lot.
Claude handles the parts that do not need judgment. It cleans and structures the raw export, compares every campaign against your benchmark file, flags what is below target, missing, or too immature to score, and builds the report in the same format every time.
It does not decide why a flagged number is off. If Google UAC D1 retention comes back under benchmark, is that a real problem, a tracking gap, or a slow cohort? That call needs someone who knows the account. It also does not decide what to do next: scale, pause, test, or wait for more data. That is still yours.
So this is not AI replacing a UA manager. It removes the hours of export-and-format work that used to sit between the raw data and the actual decision.
Frequently asked questions
Can AI automate UA reporting?
Yes, for the repetitive parts: cleaning data, applying benchmarks, flagging what is off, and producing a first version of the report. Interpretation and the decision about what to do next still need a human. The setup in this guide uses a Claude Project loaded with your KPIs and format so the report runs from a one-line prompt.
How do I automate weekly UA reporting with Claude?
Create one Claude Project per title, paste in fixed Project Instructions, upload three skill files (analysis logic, KPI benchmarks, output format), then each week paste your MMP or ad network export and type "Run Report 1," "Run Report 2," or "Run Report 3." Setup takes about 30 minutes. Each weekly report then takes roughly 2 minutes.
What is a Claude Project, and how does it help with UA reporting?
A Claude Project is a persistent workspace where you store fixed instructions and reference files, like benchmarks and report templates. Claude reuses them every time, so it does not need re-briefing. For UA reporting, that means it already knows your KPIs and format before you ask for a report.
Do I need to know how to code to set this up?
No. The setup is instructions and reference files written in plain text (.md files), not code. If you can write a clear brief, you can build this.
What KPIs should a weekly UA report include?
It depends on the game and stage, but most reports track spend, installs, CPI or eCPI, retention (D1 and D7), ROAS or ROI, CTR, and IPM, broken out by platform and network. The benchmark file in this guide scores ROAS, CPI, engagement, and retention per channel and platform.
What data do I need to upload for the report to work?
Raw exports from your MMP or ad network, the same data you would normally pull before building a report by hand. Claude prefers MMP data (AppsFlyer, Singular) for installs, eCPI, retention, and ROAS.
Does this replace a UA analyst?
No. It replaces the manual export, clean, and format cycle, not the judgment call about what a flagged number means or what to do about it.
Want this set up for your team? GamingGrowth works with mobile game and app studios on UA strategy, reporting automation, and AI-assisted workflows. Get in touch at gaminggrowth.com.